A study was conducted to determine the optimal laser diffraction particle size dispersion method for Doperidone API.
This study used Bettersizer 2600, an automatic laser diffraction particle size analyzer with a dry wet dispersion system, to enable researchers to systematically study the particle size distribution of domperidone API.
The study introduced here examined the impact of dispersion strength on particle size analysis, using a series of different air pressures for dry dispersion and a series of different ultrasonic dispersion times and stirring speeds for wet dispersion.
A comparison was made between the measurement results of wet and dry dispersion methods, and it was found that the wet dispersion method is the most suitable because it has the ability to accurately obtain results and correlate data.
The effect of domperidone
Doperidone mainly acts on the chemical receptor triggering area outside the blood-brain barrier. It is an example of a second-generation gastric motility agent - a synthetic benzimidazole derivative.
Doperidone is a dopamine receptor blocker that helps suppress vomiting, enhance gastric motility, and increase lower esophageal sphincter pressure by blocking peripheral dopamine receptors.
Doperidone has not yet been approved by the US Food and Drug Administration (FDA), but can be widely used elsewhere.
It is most commonly used to treat esophageal reflux, bloating, and vomiting caused by chemotherapy.
The solubility of domperidone particles is a key factor in their ability to be absorbed by the human body, which means understanding the impact of particle size on overall product quality is crucial.
The difference in particle size distribution between batches leads to inconsistent dissolution and absorption in vivo, directly affecting the efficacy and safety of drugs.
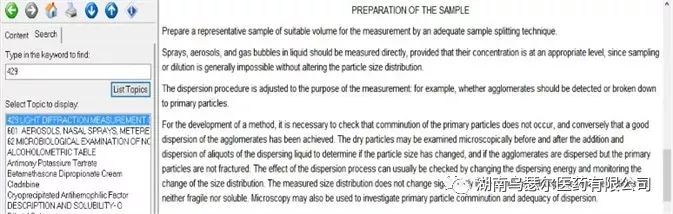
USP provides clear regulations on the API granularity for using laser diffraction. For example, information is provided on the structure and principles of the instrument, specific methods for wet and dry dispersion, and a series of factors that should be considered during the measurement process.
However, there is no guidance on the selection of wet or dry dispersion methods for specific drugs, and there is no information on evaluating this decision.
This article provides a detailed introduction to the systematic study of selecting appropriate dispersion methods for measuring the particle size distribution of domperidone raw materials. This meets the requirements of USP and ISO 13320.
experiment
instrument
This experiment used the Bettersize 2600 laser particle size analyzer from Bettersize Instruments Ltd., the MS303S electronic scale from Mettler Toledo, and the SC ultrasonic cleaning machine from Shanghai Shengyan Ultrasonic Instrument Co., Ltd.
Samples and reagents
This study used two sets of Doperidone API samples:
Non micro powder sample (batch number 0068116-17)
Micronized sample
Tween 80 is used as an analytical reagent. Pure water was also used.
Particle size distribution measurement and method evaluation: dry dispersion method
Dry dispersion uses compressed air to transport powder particles, which are dispersed through a combination of collisions with each other, pipelines, and airflow shear.
API powders are typically composed of organic small molecule particles that are prone to cracking due to collision and shear stress. Nevertheless, it is important to ensure the dispersion of large clumps without damaging the original particles.
Therefore, USP promotes the investigation of the impact of dispersion intensity on test results (USP 429).
In the dry dispersion experiment conducted during this study, the effect of dispersion pressure was evaluated based on its impact on particle size results. The dispersion pressure range ranges from 0.05 MPa to 0.4 MPa, and a set of data is tested every 0.05 MPa.
The results presented include:
Horizontal coordinate: dispersed pressure
Vertical coordinate: granularity
Blue curve: D10
Orange curve: D50
Grey curve: D90
The ideal pressure titration curve will show that the particle size gradually decreases with increasing dispersion pressure. The curve will gradually reach a stable period.
However, if the pressure increases beyond this point, the curve will further move downwards, corresponding to the gradual dispersion of large aggregates into individual particles. Any further increase in pressure may lead to the rupture of drug particles.
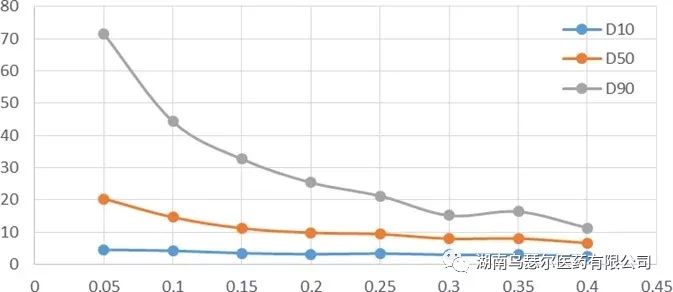
A key challenge in drug particle size determination lies in the lack of strict boundaries between aggregate dispersion and single particle fragmentation. Further experiments are needed to explore this point.
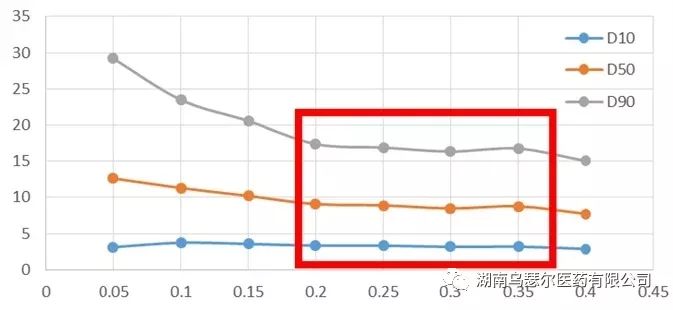
A clear stable plateau was observed in the micro powder sample (Figure 2) between 0.2 and 0.35 MPa, but further increasing the pressure on non micro powder samples resulted in the absence of a stable plateau, leading to a continuous decrease in sample particle size. This is usually a sign of particle damage.
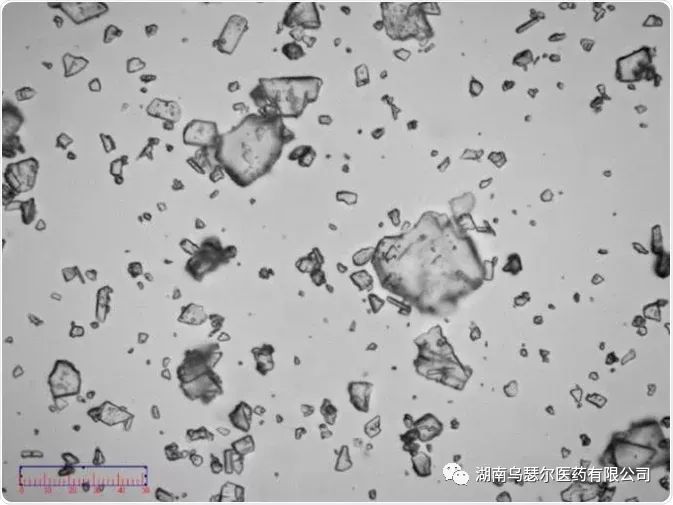
Capture images of non micronized samples (Figure 3) for further research, confirming that the samples are composed of semi transparent irregular crystal particles. The evaluation of these images indicates that as the drying dispersion pressure increases, the sample is prone to fracture.
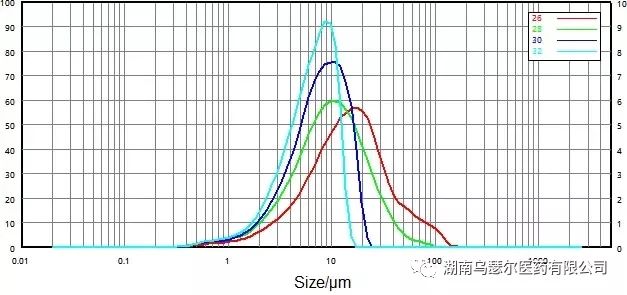
Evaluate the particle size distribution of non micronized samples under different pressures (Figure 4) to determine the optimal dry dispersion pressure. The results showed that with the increase of dispersion pressure, the maximum particle size decreased from 150-100 µ m to 30-20 µ m.
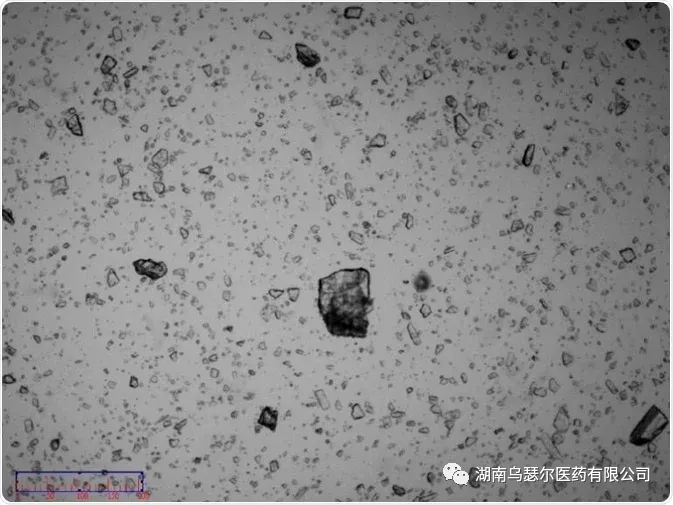
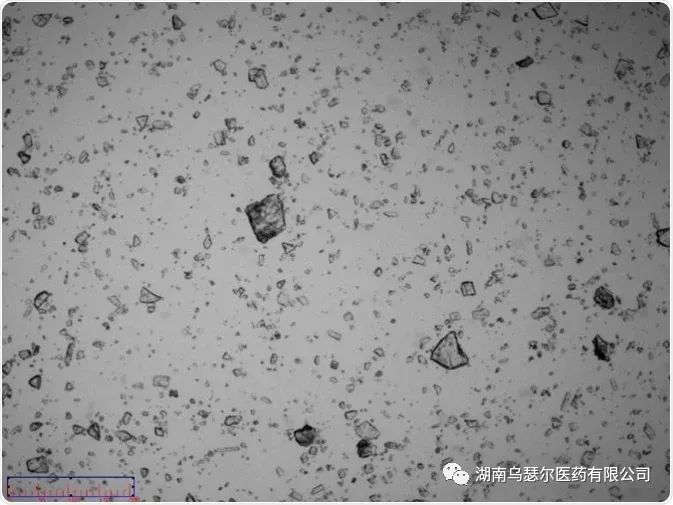
The sample image confirms the presence of some coarse particles with a size of approximately 100 µ m. These coarse particles are individual particles rather than agglomerated particles (Figure 5 and Figure 6).
The presence of particles with a particle size of approximately 100 µ m negates the assertion that the maximum particle size is 30-20 µ m. However, it can be concluded that when the dispersion pressure reaches 0.3 MPa or above, the particles will rupture.
The pressure titration curve (Figure 2) and the brittleness of the sample led to the decision to use a pressure of 0.2 MPa to test the particle size distribution of domperidone API.
The accuracy of dry dispersion method
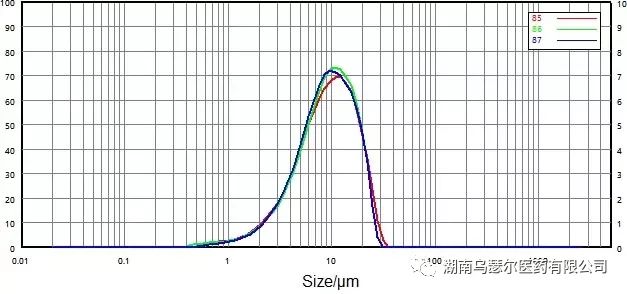
Measure the API of domperidone at a dispersion pressure of 0.2 MPa. Figures 7 and 8 show the particle size distribution curves and repeatability data of non micronized and micronized samples.
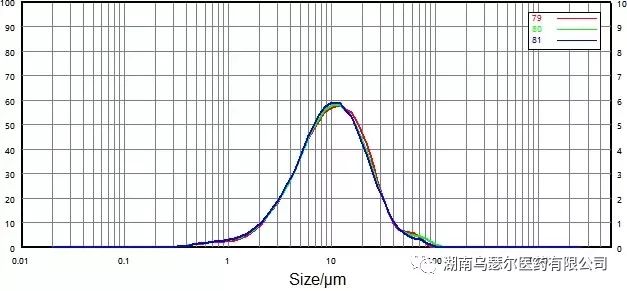
数字 | 样本 | D10/μm | D50/μm | D90/微米 |
|---|
79 | 0068116-17 非微粉化-0.2 | 3.332 | 10.31 | 26.44 |
80 | 0068116-17 非微粉化-0.2 | 3.222 | 10.13 | 26.79 |
81 | 0068116-17 非微粉化-0.2 | 3.157 | 9.905 | 25.91 |
标准差 |
| 2.73% | 2.01% | 1.68% |
数字 | 样本 | D10/μm | D50/μm | D90/微米 |
|---|
85 | 0068116-17 微粉化-0.2 | 3.274 | 9.341 | 19.27 |
86 | 0068116-17 微粉化-0.2 | 3.398 | 9.377 | 18.63 |
87 | 0068116-17 微粉化-0.2 | 3.505 | 9.174 | 18.60 |
标准差 |
| 3.41% | 1.17% | 2.01% |
Figure 8. Particle size distribution and repeatability of micronized particles (dry dispersion)
The repeatability of two samples easily exceeds the requirements outlined in USP: D50 has a repeatability of less than 2.1%, while D10 and D90 have a repeatability of less than 3.5%.
These values confirm that the dry dispersion method is a reliable method for measuring the particle size distribution of domperidone API.
Particle size distribution measurement and method evaluation: wet dispersion method
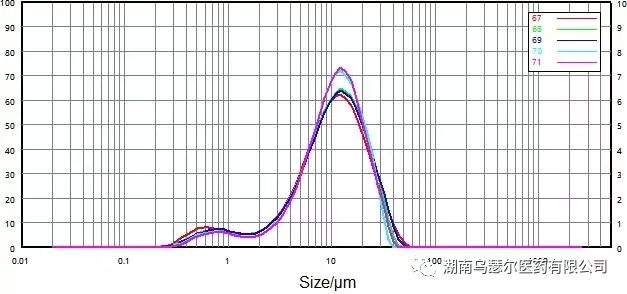
The Doperidone API is insoluble in water, which means that it must be wetted with a surfactant before being dispersed in water through stirring and ultrasonic dispersion. Its brittleness means low dispersion strength.
数字 | 样本 | D10/μm | D50/μm | D90/微米 |
|---|
67 | 0068116-17 微粉化-B | 2.066 | 10.14 | 24.21 |
68 | 0068116-17 微粉化-B | 2.481 | 10.49 | 23.71 |
69 | 0068116-17 微粉化-B | 2.514 | 10.622 | 4.57 |
70 | 0068116-17 微粉化-B | 3.127 | 10.63 | 22.06 |
71 | 0068116-17 微粉化-B | 3.297 | 10.74 | 22.54 |
标准差 |
| 18.75% | 2.21% | 4.61% |
数字 | 样本 | D10/μm | D50/μm | D90/微米 |
|---|
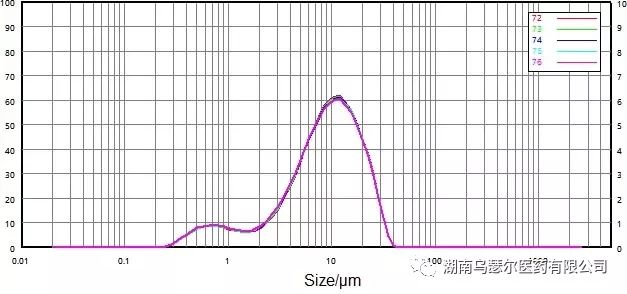
72 | 0068116-17 微粉化-C | 1.719 | 9.200 | 21.35 |
73 | 0068116-17 微粉化-C | 1.716 | 9.154 | 21.31 |
74 | 0068116-17 微粉化-C | 1.660 | 9.120 | 21.32 |
75 | 0068116-17 微粉化-C | 1.666 | 9.089 | 21.32 |
76 | 0068116-17 微粉化-C | 1.616 | 9.031 | 21.25 |
标准差 |
| 2.57% | 0.70% | 0.17% |
Figure 10. Particle size distribution of the test sample after only stirring and dispersion.
Apply stirring and ultrasonic dispersion methods (Figure 9 and Figure 10) respectively to determine the effect of dispersion strength on sample particles.
When only the stirring method is applied to the sample, the results are unstable, and the characteristic of wet dispersion means that the drug particles can still adhere.
However, the stability was significantly improved after low intensity ultrasound dispersion. Ultrasonic dispersion has the smallest impact on particle size distribution - its main impact is the tailing of large particles.
The repeatability under low intensity ultrasound dispersion is also greatly improved, so it is decided to use low intensity ultrasound method in subsequent wet dispersion.
The accuracy of wet dispersion method
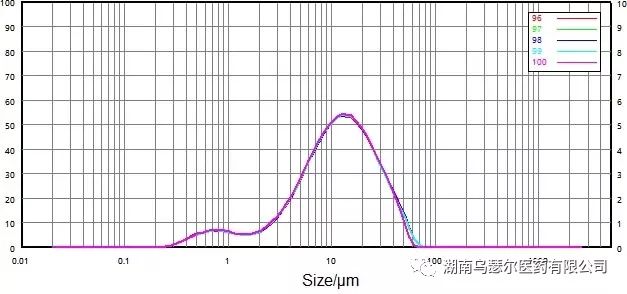
The accuracy of particle size distribution data during dispersion of samples using low intensity ultrasound was investigated using the same experimental conditions mentioned above.
数字 | 样本 | D10/μm | D50/μm | D90/微米 |
|---|
96 | 0068116-17 非微粉化-C | 2.632 | 11.68 | 32.51 |
97 | 0068116-17 非微粉化-C | 2.640 | 11.69 | 32.29 |
98 | 0068116-17 非微粉化-C | 2.627 | 11.66 | 32.30 |
99 | 0068116-17 非微粉化-C | 2.615 | 11.60 | 31.96 |
100 | 0068116-17 非微粉化-C | 2.552 | 11.44 | 30.91 |
标准差 |
| 1.35% | 0.89% | 1.99% |
Figure 11. Particle size distribution and repeatability of non micronized samples (wet dispersion).
数字 | 样本 | D10/μm | D50/μm | D90/微米 |
|---|
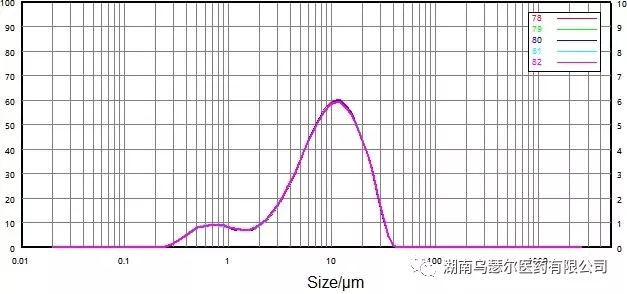
78 | 0068116-17 微粉化-C | 1.611 | 9.008 | 21.29 |
79 | 0068116-17 微粉化-C | 1.595 | 8.971 | 21.28 |
80 | 0068116-17 微粉化-C | 1.579 | 8.945 | 21.22 |
81 | 0068116-17 微粉化-C | 1.570 | 8.944 | 21.28 |
82 | 0068116-17 微粉化-C | 1.561 | 8.916 | 21.23 |
标准差 |
| 1.26% | 0.39% | 0.15% |
Figure 12. Particle size distribution and repeatability (wet dispersion) of micronized samples.
Figures 11 and 12 both show the particle size distribution and repeatability data of wet dispersion for non micronized and micronized samples.
Compared with dry dispersion, the repeatability is greatly improved: the relative deviation of D50 and D90 is less than 0.7%, while the relative deviation of D10 is less than 2.6%.
These findings confirm that wet dispersion is more reliable than dry dispersion for measuring the particle size distribution of domperidone API.
Comparison and evaluation of wet and dry dispersion methods
In terms of testing accuracy, wet dispersion is a better choice than dry dispersion. This is because particles only pass through the test area once during the dry dispersion process, while wet dispersion causes them to repeatedly pass through. This leads to a higher sampling frequency during wet dispersion.
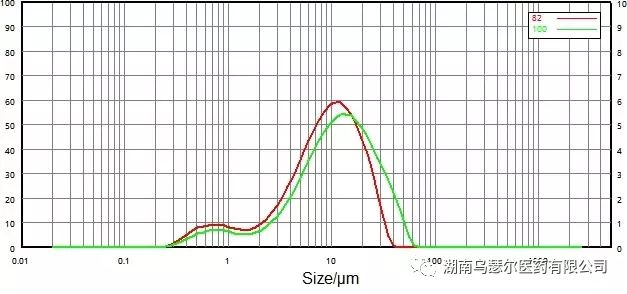
数字 | 样本 | D10/μm | D50/μm | D90/微米 |
|---|
82 | 0068116-17 微粉化-C | 1.561 | 8.916 | 21.23 |
100 | 0068116-17 非微粉化-C | 2.552 | 11.44 | 30.91 |
Figure 13. Comparison of particle size distribution results before and after micronization (wet dispersion).
数字 | 样本 | D10/μm | D50/μm | D90/微米 |
|---|
81 | 0068116-17 非微粉化-0.2 | 3.157 | 9.905 | 25.91 |
86 | 0068116-17 微粉化-0.2 | 3.398 | 9.377 | 18.63 |
Figure 14. Comparison of particle size distribution results before and after micronization (dry dispersion).
Figures 13 and 14 show the particle size distribution data of non micronized and micronized samples obtained through dry and wet dispersion methods.
In terms of the relative rationality of the data, the wet dispersion method shifts the particle size distribution peak towards smaller particles after micronization. D10, D50, and D90 all showed varying degrees of decline.
However, for the dry dispersion method, significant changes occurred in the large particles before and after micronization, while the fine particles remained almost unchanged.
conclusion
These experiments confirm that both wet and dry dispersion methods can provide high-precision results for determining the particle size distribution of domperidone API.
Due to the fragility of the Doperidone API, more data is needed on sample dispersion selection, especially for dry dispersion methods.
In these experiments, it was found that the data provided by wet dispersion has higher repeatability, correlation, and rationality compared to the data provided by dry dispersion.
Therefore, it can be concluded that the wet dispersion method is a good choice for analyzing the particle size distribution of domperidone API.